
Love is spontaneous and quick, it comes without warning or explanation- unless you’re a man. Men, those rational and emotionless creatures- their favorite thing is to hyperanalyze the goofiest stuff and reduce as much of the unforgiving chaos of life into nice, predictable numbers. Man’s second favorite thing is beautiful women, and thus, the 1-10 rating system has become a universal pastime during downtown day-drinking sessions the world over.
There are two reasons to assign a rating to a woman. First, to gauge the risk in your approach. Do you really want to hit on that 3? If it works out, what would the homies think? If it doesn’t, do you think you could handle that blow to the ego? Say you’re approaching a 9. You’ll need to really lather on the confidence for this one, with the risk that she’s a cunty and unpleasant brat. The second reason is to give an idea of the situation when telling your friends about it later.
Men don’t like details. Details get in the way of the big picture. When we talk about a car we were looking at buying, we only need to know the basics: mileage, year, make, body type (hey, just like women! Why is my face so sore?). These basic things can help provide an overall image of the car in the minds of everyone at the table. Now we can all imagine ourselves in this exact shopping scenario.
The function of this highly-mathematical, detail-omitting, big-picture thinking is to standardize the conversation. Every man needs to be imagining himself buying this car in order to appreciate the story and weigh in with his own expertise. If Bro 1 is describing a like-new pickup truck but Bro 2 is imagining a Toyota Corolla with 218,000 miles on it, we aren’t getting anywhere. Creating an imaginary landscape serves to get us all on the same page; it’s not to reduce a beautiful machine to its most basic details.
“So, dude, I met up with this chick last week…” says Bro 1. Ah, our favorite subject: getting laid! Everyone at the Barstool Council scooches to the edge of their seats for a thrilling and didactic tale. An elephant become immediately obvious in this room- how hot was she? It’s a crucial part of the story, because a man approaches a situation with a 5 differently than he would a 9.4. We need to know how hot she was so we can all be on the same page.
Bro 1 could start describing her physical features, her beautiful curly blonde hair and tan legs that go all the way up… but every guy has different taste. Bro 2 is drooling at the thought of this leggy bombshell, but Bro 3 likes thicker Latina chicks. Thus, we don’t get any closer to cohesion by getting into the physical details. Appreciating the nuances of the woman’s beauty on a case-by-case basis (the way we’re supposed to do it, apparently), has gotten us nowhere. With the 1-10 rating scale, we have a reliable, standardized procedure to make sure that everyone is envisioning the subject of this story in the same way.
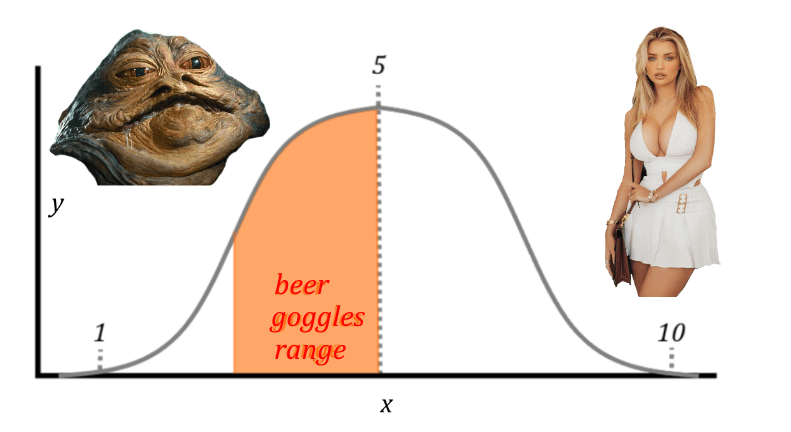
To understand these systems, we first need to understand the normal distribution, also called a “bell curve.” You may remember this from a high school math class that you slept through:

The basic idea is that the average of a given data set is at the center, in our case, a 5. MOST of your data will fall within one standard deviation (σ) of the mean; that is to say 68% of women are between 4 and 6. As you get further away from the mean, the percent of the population reduces non-linearly, creating this curve. So, 2 standard deviations (2σ) from the mean puts you between 2.8 and 4, or between 6 and 7.2. This group makes up 27.2% of the data set- making it roughly 1/2 as common as the average. And so on. A 10 and a 1 are equally common on the extreme end, at about 0.3% of the total population.
To put it in words that retards like you can understand: in a group of 100 women, sixty-eight of them are 5s. There are fourteen 7s and fourteen 3s, six 8s and six 2s. There MIGHT be a 10 or a 1 in the mix.
Men seem to have a pretty good handle on this concept instinctively, no statistics degree required. Applying hard science to the swiping patterns of men vs women on dating apps has given us this exact distribution. Women’s swiping patterns give us a whole different curve, called a Pareto distribution, which we’ll get into a bit at the end of this article.
Due to disagreement within the scientific lechery community, there are three rating systems that we’ll have to go over. Let us first look at the similarities between them. Firstly, 5 is average. No man is ever so stuck up that he wouldn’t smash a 5. Between 3 and 5 is where men get a little choosier, we’ll call this the beer goggles range. Below a 3 is generally accepted as a pass, but everyone knows men are pigs and desperation makes fools of us all. On all of these scales, anything above a 7 is considered sexy.
Now, let’s analyze the differences.
1: THE ABSOLUTE SCALE
The main source of disagreement in these scales is: do 10s exist? Those who us the absolute scale say YES. 10s exist, there is a definite maximum on beauty, but women who fall into this category are exceedingly rare. Remember, every standard deviation from the mean represents a smaller and smaller data set- using the 68-95-99.7 rule we can reason that a 10 and a 1 combined make up 0.3% of our data set (following the logic from Adioma.com: If a person lives an average of 78.3 years, we remember people we meet after age 5, and we meet three new people every day, we can expect to interact with 80,000 people over our lifetimes. That means our odds of meeting a 10 in person (in a world of 8 billion) are 75 to 1! So don’t throw the word 10 around willy-nilly).
The unique thing about the Absolute Scale is its use of whole numbers. Having a maximum and minimum on the scale means that the curve is steeper; thus a multiple-decimal jump from 7 to 7.5 is a big deal, but a jump from 7 to 7.1 is trivial. You can easily round up or down and retain an approximate rating of the girl in question.

2: THE ASYMPTOTIC SCALE
This scale assumes the opposite of the Absolute Scale: that there is no maximum beauty, and a 10 cannot exist in the real world. The 10 is a hypothetical. It represents perfection, and nobody’s perfect. Conversely, a 1 cannot exist, either. The ends of this normal curve stretch to infinity, never quite touching 10 or 1, but getting infinitesimally closer as you get further away from the mean. This curve is much flatter than the Absolute Scale, thus depends heavily on decimal points.
On a flatter slope, 7.1 is a lot further away from 5 than 7 is from 5. Equating a 7.1 with a 7 is too much of a generalization. This becomes even more of an issue in the extreme ends of the scale, because as the slope gets flatter the distance between decimal points increases way more. A 7.99 isn’t that much hotter than a 7.9, but a 9.99 would be way the hell out of a 9.9’s league.
The difference between the Absolute Scale and the Asymptotic Scale is more philosophical than scientific- it depends on whether you believe there should be a cap on beauty. Some people prefer the Asymptotic Scale for its scientific accuracy alone and think that the Absolute Scale is too general.
3: THE O’NEAL SCALE
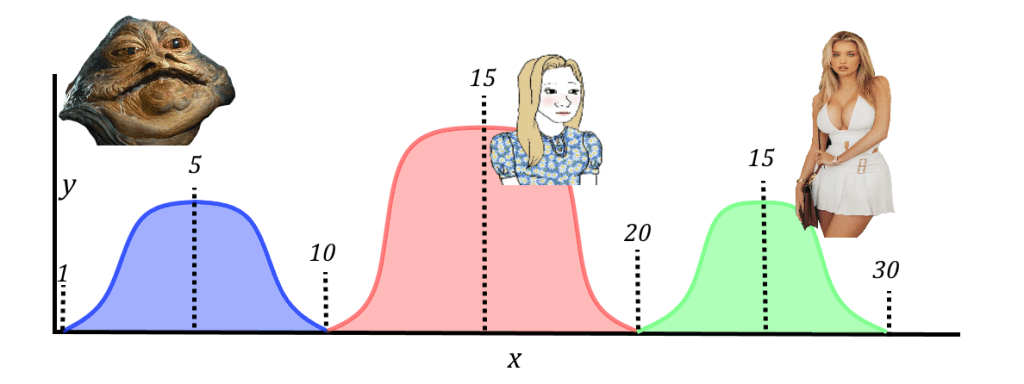
This is the most complex scale of all, developed by pickup professor Patrice O’Neal to break the normal distribution into 3 distinct scales and provide the most accurate numerical representations of beauty possible.
The O’Neal Scale is based on a 1-30 metric, split into three Absolute Scales of 1-10. The first curve on this scale includes the numbers 1-10, 5 being the average of this set. This set is used to rate “ugly girls.” The second set, used to rate “normal girls,” ranges from 11-20, with 15 as the average. This makes 15 the absolute average of the O’Neal scale. Lastly, numbers 21-30 represent “pretty girls,” with 25 representing an average pretty girl. As an Absolute Scale, 1s and 30s are theoretically possible using this system.
This scale eliminates the need for decimal points entirely by breaking a wide, shallow curve into three steep curves to serve specific data sets. With this scale, a 15 can’t even be compared to a 8 because they’re in different leagues. It just isn’t fair to compare an average-average girl to a very pretty ugly girl. A 22 (ugly pretty girl) is something else entirely.
This scale is very nuanced and takes a lot of practice to use. It’s not as widely accepted in bro communities because it’s much less intuitive than a standard 1-10, but if you can master the intricacies of the O’Neal Scale, you and your homies can rate women with the more accuracy and fairness.

Appendix: Pareto Distribution
Women don’t seem to grasp the non-linear part of these scales. This isn’t just because women are bad at math- they have their own rating scale that is completely different than the 1-10 scale used by men.
This graph comes from the same study that we used to establish that men’s swiping habits form a normal distribution. Women’s swiping patterns create a Pareto distribution, where a tiny minority of men are suitable and 80% of the data pool is like, totally gross. This is incompatible with 1-10 scale thinking. This is a 0-1 scale. A Smash or Pass scale. There is no gray area in this Pareto distribution, so the idea that a 5 can still be pretty is confusing and strange. Ladies, if a man tells you you’re a 5, he doesn’t mean 50% pretty. He means you’re average. Average is still pretty. By the way, any man will choose an easy-going and lovable 5 over a a psycho 9, any day.

Spud Underground is designed for print.
ESPECIALLY this issue. Order your copy or subscribe for future issues.